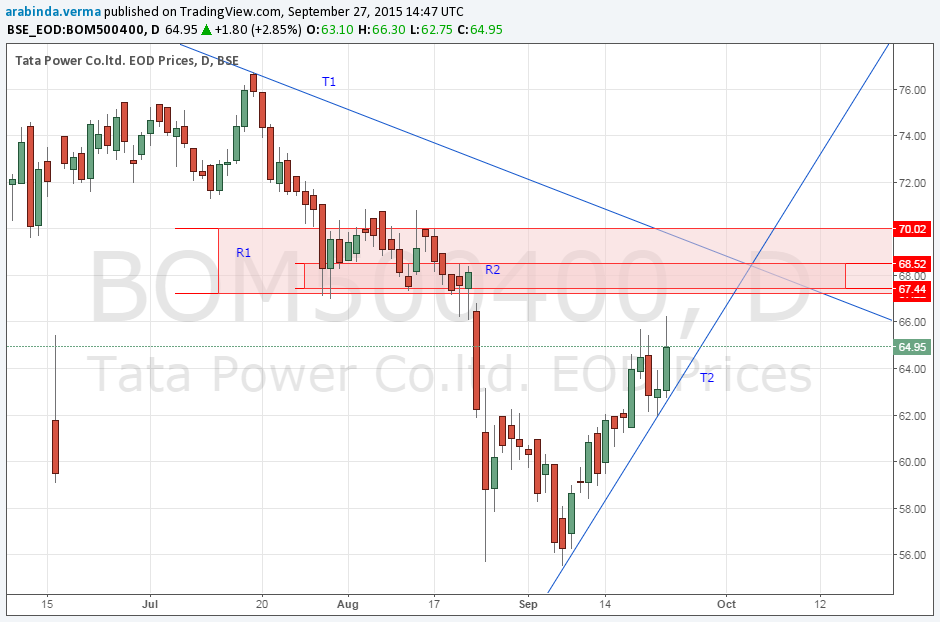
Sunday, September 27, 2015

Tata Power [BOM500400]


Observations:
   Weekly long term trend [T1]: DOWN
   Weekly and daily short term trend [T2]: UP
   Weekly supply zone [R1]: 67.2 ~ 70.05
   Daily supply zone [R2]: 67.40 ~ 68.5 - It is inside R1.

It should be observed in coming days and weeks to test R1 & R2. Lets see how it pans out.

The above charts are created using tradingview.

Disclaimer: The views presented on desibullz are my personal views. The analysis is my study of technical analysis and for educational purpose only. The views and analysis are not trading tips and should not be used for trading. The financial gain/loss arising by using the views/analysis is personal responsibility of stock trader/investor.

Saturday, September 26, 2015

Marksans Pharma Ltd. [MARKSANS]


Observations:
   Monthly, weekly and daily trend: UP
   Monthly demand zone [R1]: 56.2 ~ 63
   Monthly supply zone [R2]: 107.3 ~ 115
   Weekly CP [R3]: 82.75 ~ 89

Monthly trend: T1, Weekly trend: T2 & Daily trend: T3

Daily supply zone [R4]: 108.2 ~ 114.30 - It is inside R2
Daily demand zone [R5]: 56.45 ~ 58.85 - It is inside R1

The above charts are created using iCharts and tradingview.

Disclaimer: These are my personal views and should not be treated as trading tips.

Friday, September 25, 2015

Adani ports & special economic zone ltd. [ADANIPORTS]

Adani ports has been trading in a range of 290 to 370 for couple of months.


Yesterday, it closed near to 300 mark closing below weekly 50 SMA.


On daily chart, it broke 200 SMA. If the trading range is respected again, we may see a bounce from range of 290 to 300. That is possibility P1 as shown in following chart.


Else, P2 and P3 seems to be on cards. Lets see how it pans out.

Bhavikk Shah's post has interesting information on Adani ports.

The above charts are created using iCharts and tradingview.

Disclaimer: These are my personal views and should not be treated as trading tips.